%20(1).png)

Author: Richard A. Milam | Organization: 5 Layers Deep | Lakeland, FL | September 2026
This memo documents an acoustic method for finding yellow-legged hornet (Vespa velutina) nests, the invasive honeybee predator now established in coastal Georgia. Individual hornets are nearly impossible to hear at a distance, but a nest containing thousands of workers is a fundamentally louder target: sound power from many uncorrelated sources adds directly, so a nest with an effective 100–1,000 simultaneous fliers and fanners is roughly 20–30 dB louder than one hornet, extending plausible detection range from a few meters to on the order of 50–150 m in quiet conditions [est.].
The proposed system is a portable three-microphone array with wired, sample-synchronous data acquisition. It measures the tiny time differences with which the nest's hum arrives at each microphone (time-difference-of-arrival, TDOA) and converts them to a compass bearing. Two bearings from separated positions intersect at a search box; the operator then leapfrogs the array toward the intersection, and closes out the final ~100 m with a thermal camera at dawn or night, when the nest's self-regulated core temperature (~30 °C) contrasts most with ambient air. The memo covers the frequency physics, a hardware block diagram, specific equipment, and setup and operating procedures.
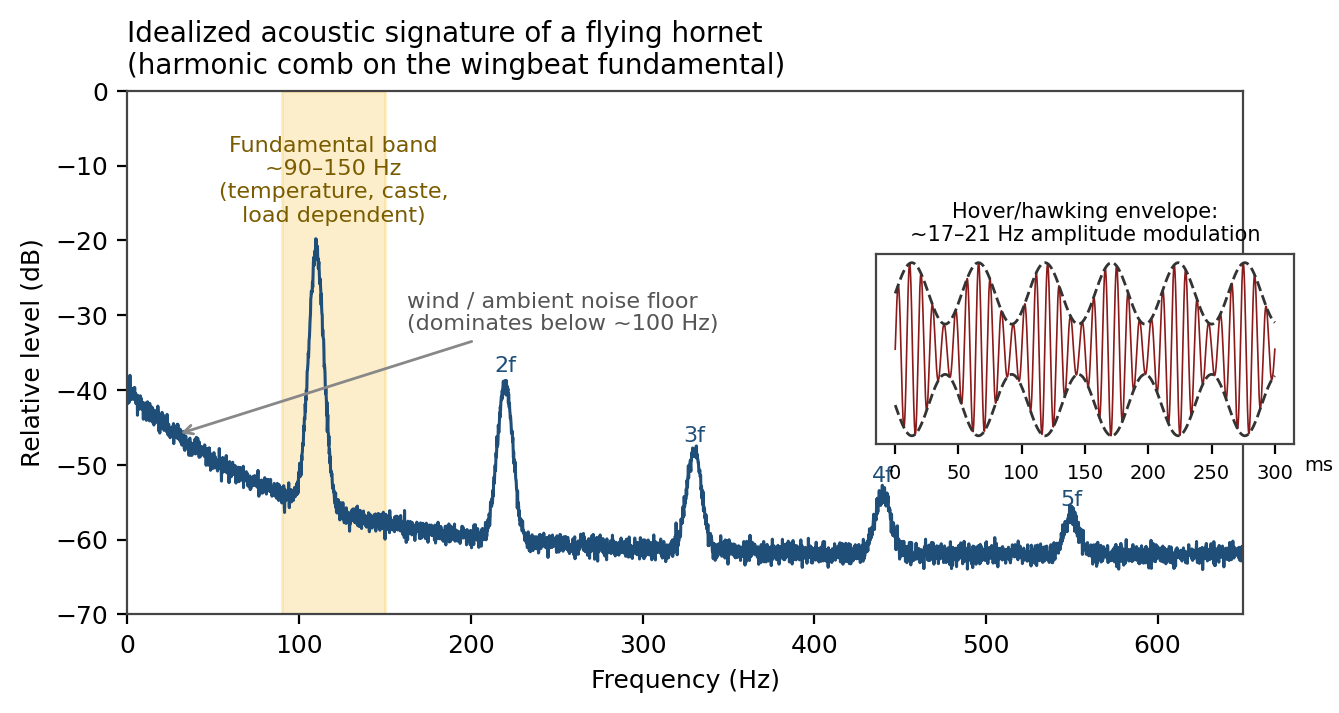
The flight tone is the wingbeat itself: each wing stroke pushes a pressure pulse into the air, so the fundamental frequency of the sound equals the wingbeat rate in beats per second. Because the stroke is not a pure sine motion, the tone carries harmonics — energy at exact integer multiples of the fundamental (2f, 3f, 4f...). This "harmonic comb" is the fingerprint the detector looks for: a lawnmower or HVAC unit may put energy near the fundamental, but it will not reproduce the comb spacing plus the hornet's modulation statistics.
The wingbeat fundamental of V. velutina was first reported in 2023 from optical-sensor recordings of lab flights; that study found V. velutina and the European hornet V. crabro had the lowest fundamentals of seven Hymenoptera species tested, consistent with the rule that bigger insects beat slower [lit.]. Sister species anchor the band: V. crabro ~100 Hz, V. simillima ~100 Hz, V. orientalis ~125 Hz [lit.]. For planning purposes this memo uses a working fundamental band of ~90–150 Hz [est.], wide enough to cover caste, temperature, and load variation. A 2025 acoustic study of hovering ("hawking") flight at apiaries added a second, highly usable feature: the hover produces a systematically repeating waveform — an amplitude modulation of roughly 17–21 Hz riding on the wingbeat tone — which proved to be a strong discriminator against honeybees [lit.]. Honeybee workers, for reference, beat at roughly 230–250 Hz [lit.], comfortably above the hornet band, which is what makes species separation practical.
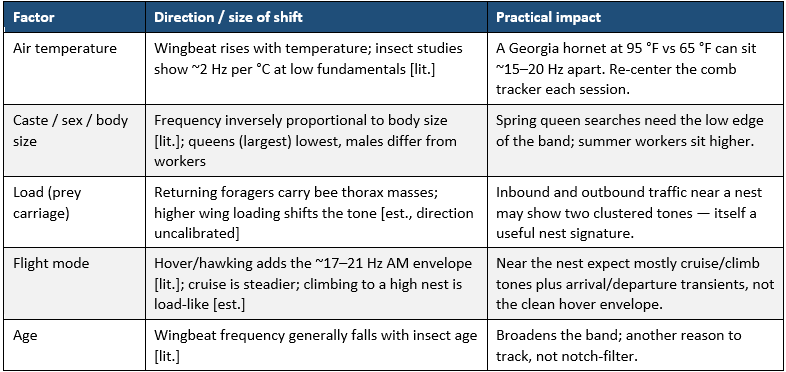
The fundamental is not one number; it is a distribution that moves with the animal and the day. The detector must therefore track a floating fundamental across the band rather than filter at a single literature value. The main drivers:
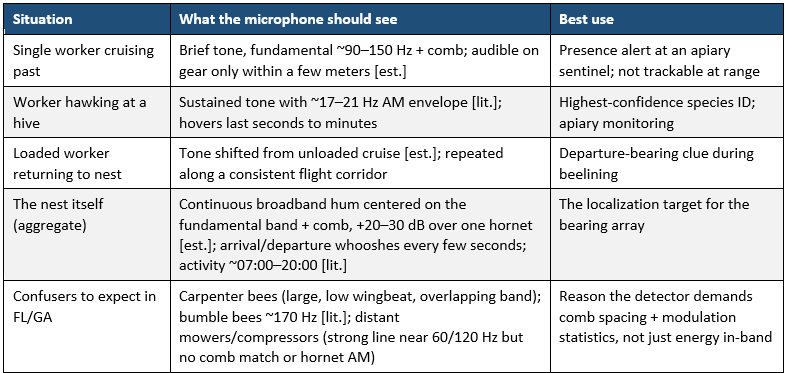
The array of Sections 3–7 answers where; a fixed sentinel microphone at each hive answers when. The sentinel is one cheap wind-protected microphone per hive, listening continuously. It needs no bearing capability — its only job is to raise an alert that hornets are working the apiary right now, at which point the operator deploys the bearing array and begins the Section 3 field sequence with the hunt pre-narrowed to hornets commuting from an active nest.
The trigger has two independent legs. The first is the hornet itself: the hawking signature of Section 2.2 (90–150 Hz comb plus the 17–21 Hz hover envelope) heard at the hive entrance. The second is the colony’s own reaction — the “frightened” sound of the hive — and this is a real, measurable phenomenon.. Honeybee colonies under disturbance produce brief broadband hissing bursts and piping signals with fundamentals roughly in the 330–450 Hz band [lit.], and the Asian honeybee Apis cerana emits harsh, frequency-modulated “antipredator pipes” specifically when hornets appear at the nest [lit.] — direct proof that hive sound encodes hornet threat. For A. mellifera facing V. velutina, the best-documented response is behavioral: hawking pressure collapses foraging traffic (“foraging paralysis”) [lit.], whose acoustic shadow is a dropout of the colony’s own 230–250 Hz flight tone at the entrance [est.]. The velutina-specific alarm signature of local European-honeybee colonies has not been published and must be recorded on site — added as item (4) in Section 8.
The sentinel therefore votes across three cues rather than trusting one: (a) sustained hornet comb + hover-envelope detection, (b) hissing/piping rate above the colony’s own baseline, and (c) flight-tone dropout relative to the same hour on quiet days. Any two of the three constitutes an attack alert pushed to phone alert. Requiring agreement keeps a passing mower or a routine orientation flight from crying wolf, and baselining each hive against itself absorbs colony-to-colony personality. Because no channel-to-channel timing is involved, the sentinel is the one place in the system where a cheap wireless or USB microphone is acceptable.
Why this can work at range: sound at ~100 Hz is a favorable messenger. Atmospheric absorption at that frequency is essentially negligible over hundreds of meters, and 3.4 m wavelengths diffract around leaves and branches instead of being blocked — precisely where line-of-sight methods (visual, thermal, harmonic radar) struggle in canopy. The obstacle is not attenuation but the wind-noise floor, which the array defeats by correlation: wind noise is uncorrelated between microphones spaced more than about a meter apart, while the nest's tone is correlated across all three. Cross-correlating channels therefore averages the wind toward zero while the hornet signature integrates up — the same trick infrasound arrays use to pull volcano signals out of much louder wind.
The same cross-correlation yields direction. Sound from a distant source reaches the three microphones at slightly different times; with 6–10 m baselines, arrival differences are up to ~30 ms, and 48 kHz sample-synchronous channels resolve time to ~0.02 ms. Geometry converts the two independent time differences into a bearing; realistic accuracy in field noise is roughly ±5–10° [est.], which at 250 m is a ±25–45 m wide wedge. Because a single ~110 Hz tone repeats every 9 ms and can alias across a long baseline, the processor correlates the whole 80–600 Hz comb (the harmonics act like a wideband signal) and, when present, the demodulated AM envelope — both of which resolve the ambiguity.
In apiary-defense use, the sequence below is initiated by a Section 2.5 sentinel alert — the sentinel supplies now and near this hive; the array then supplies which way. Field sequence (Figure 2): take bearing #1 from position A, walk 300–400 m laterally and take bearing #2 from position B; the wedges intersect at a search box typically tens of meters across. Leapfrog the array to ~100–150 m (position C) for a refined bearing and a rising received level ("hot/cold" confirmation — level grows ~6 dB per halving of distance in open conditions [est.]). Do not attempt visual search from there; instead return in the cool of dawn or at night and sweep the search box with a thermal camera. Occupied V. velutina nests thermoregulate and have been detected by thermal imaging from the ground and from drones, with useful range generally inside ~100 m [lit.] — exactly the box of the acoustics hand off.
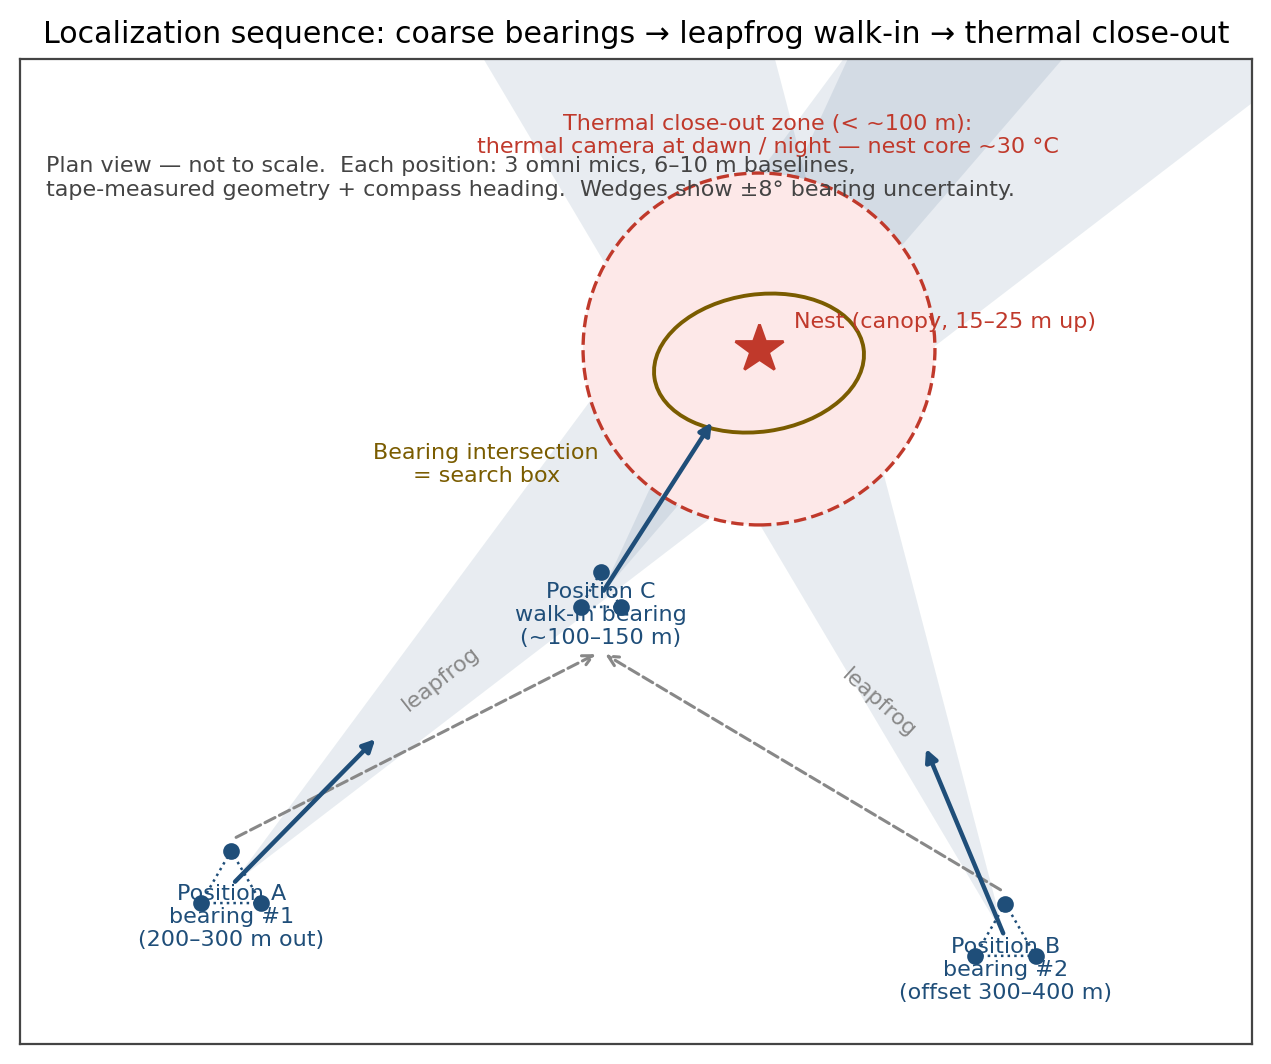
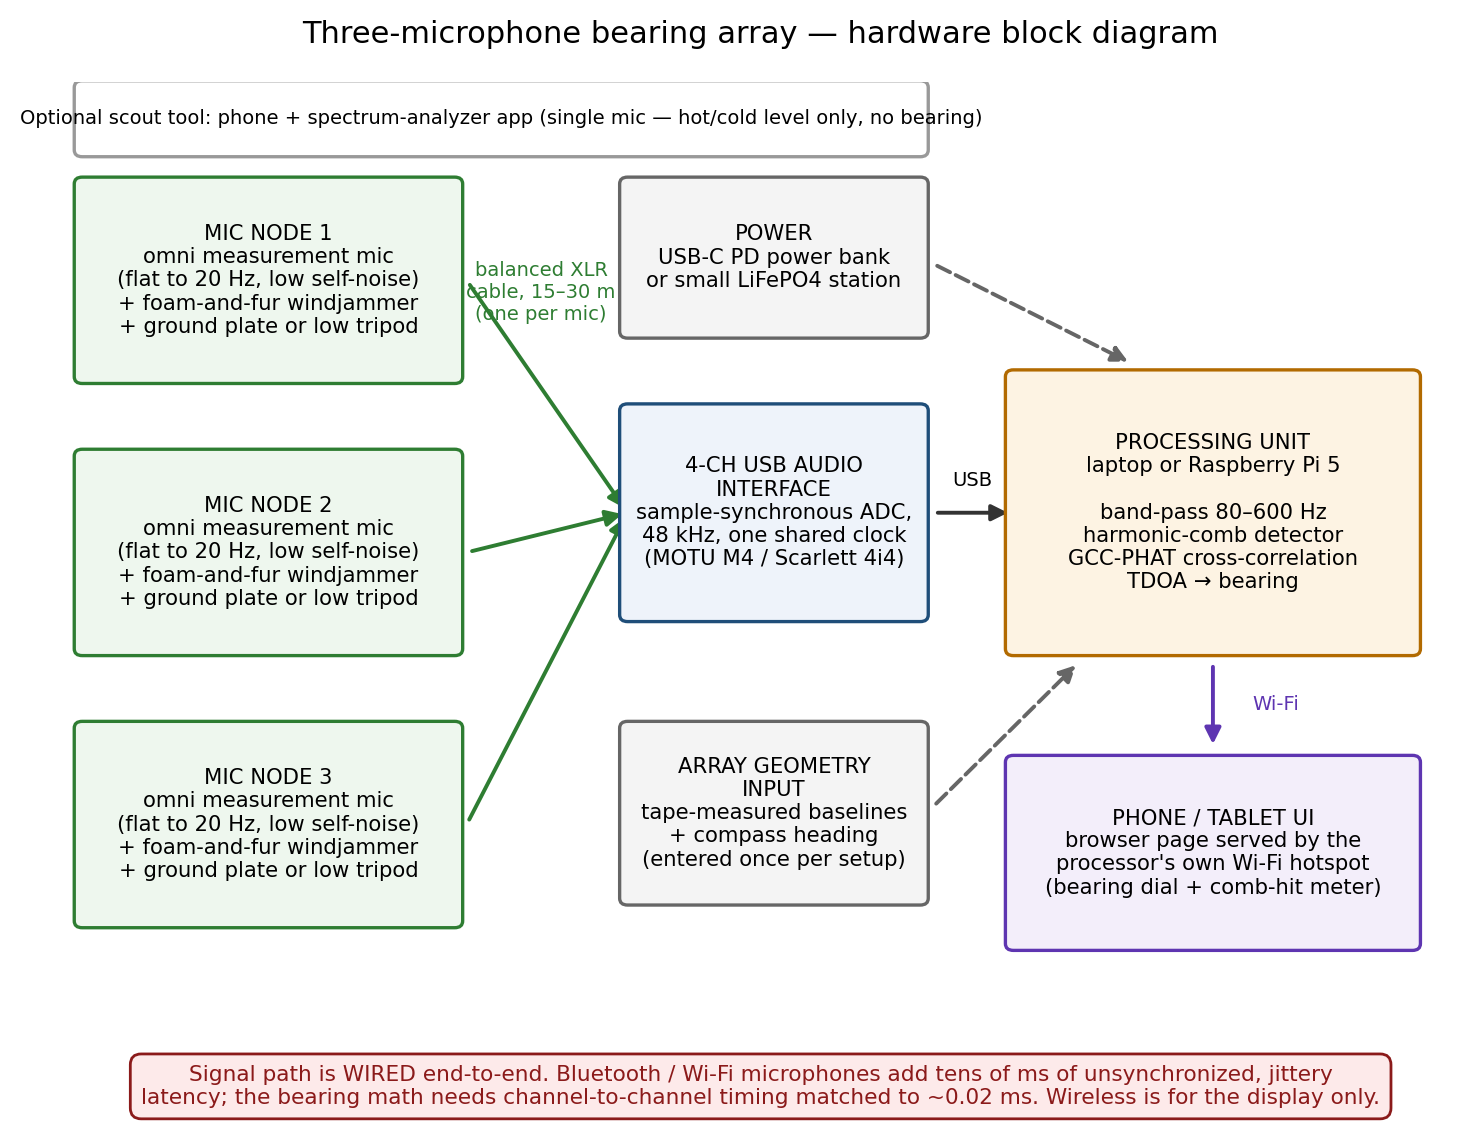
Figure 3 shows the full hardware chain. Three wind-protected measurement microphones cable into one 4-channel USB audio interface, which digitizes all channels on a single shared clock; a laptop or Raspberry Pi runs the comb detector and the bearing math; and the result is displayed on a phone. Each element is discussed below, starting with the one architectural decision that everything else hangs on.
Bluetooth microphones cannot be used in the signal path, and the reason is quantitative. The entire bearing measurement lives in channel-to-channel timing: at 343 m/s, every 1 ms of timing error corresponds to 34 cm of acoustic path error, and with a 8 m baseline the full A-to-B arrival spread is only ~23 ms. Bearing accuracy of a few degrees requires channels matched to roughly 0.02–0.1 ms. Bluetooth audio links carry tens of milliseconds of buffering latency that is different for every link and drifts continuously; consumer Wi-Fi microphone streams behave the same way. Run three of them and the computed "time differences" measure the radios, not the hornets. Three cables into one USB interface with a single shared converter clock makes the synchronization problem vanish — every sample on every channel is taken at the same instant by construction. Wireless is reserved for the harmless direction: the processor broadcasts its own Wi-Fi hotspot and serves the bearing display as a web page to any phone, which gives the "app on your phone" experience with nothing to install and no timing consequences.
Wind is the noise floor at 100 Hz, so it is attacked three ways at once. Physically: each microphone wears an open-cell foam windscreen inside a synthetic-fur windjammer, which together suppress turbulence noise by ~20–30 dB at low frequency, and is mounted low (ground plate or 1 ft stand), since wind speed near the ground is a fraction of head-height wind. Statistically: the >1 m spacing makes residual wind uncorrelated between channels, so the cross-correlation discards it. Operationally: bearing runs are scheduled for calm windows — early morning is typically calmest, and conveniently hornet flight activity spans roughly 07:00–20:00 [lit.], so a calm 7:30–9:30 AM session gets both quiet air and active traffic.
The bearing solution assumes the three microphones sit in one horizontal plane, so a height error Δz on any microphone biases that channel’s arrival time by Δz·sin ε divided by the speed of sound, where ε is the elevation angle of the source above the array plane. The tolerance is therefore range-dependent, and generous at standoff: a canopy nest 50 ft up viewed from 250 m sits at ε ≈ 3–4°, where even a 1 ft height mismatch produces only ~0.05 ms of timing bias — a fraction of a degree of bearing error on an 8 m baseline [est.]. The working rule: hold all microphones within ±6 in of a common horizontal plane as standard discipline (ground plates make this nearly automatic), and treat ±1 ft as acceptable beyond 150 m standoff. Inside 150 m the source elevation angle grows and the coplanar error grows with it — one more reason the procedure already stops bearing work at 100–150 m, or hands off to the deliberate 3-D mode of Section 4.4. On sloped ground, “same height” means the same horizontal plane, not the same height above local grade: a string line and a $5 line level, or a rotary laser, sets three stations in minutes.
A phone can verify that the microphones are on the same plane. The right phone sensor is the barometer: its absolute altitude drifts with weather, but relative readings taken minutes apart within one session resolve height differences to roughly ±0.1–0.3 m [est.]. Set the phone flat on microphone 1’s head and log; repeat on 2 and 3; the app differences the barometric readings, flags any station out of tolerance, and prompts a shim. The Section 6 clap test then confirms geometry end-to-end. Phones without barometers (some budget models) fall back to the string line.
Once bearings have shrunk the search box, the most valuable remaining unknown is how high the nest is, because it tells the thermal operator where in the canopy to sweep. A non-coplanar microphone array measures elevation angle by the same time-difference arithmetic a flat array uses for azimuth. The 4-channel interface has a spare input, so hoist a fourth microphone 3–6 m up a telescoping painter’s or flag pole at the array center. The horizontal triangle keeps producing its azimuth solution untouched, and the low/high pair reads elevation independently. Added cost: one more ECM8000, one cable, one pole — roughly $100.
A nest at ground level, 10–20 ft up, or 20–50 ft up corresponds to elevation angles of roughly under 2°, 2–5°, and 5–15° at those ranges, which across a 4 m vertical baseline are timing spreads of ~0.4–2 ms — 20 to 100 times the system’s 0.02 ms resolution [est.]. The honest limits are signal-to-noise and ground-reflection multipath, which smears the lowest angles, so treat the output as a three-bin classifier — ground level / 10–20 ft / 20–50 ft [est.].
Street prices are approximate 2026 figures for budgeting; verify current pricing before ordering. The prototype build assumes an existing Windows/Mac laptop; the Raspberry Pi option replaces it for a self-contained field box.
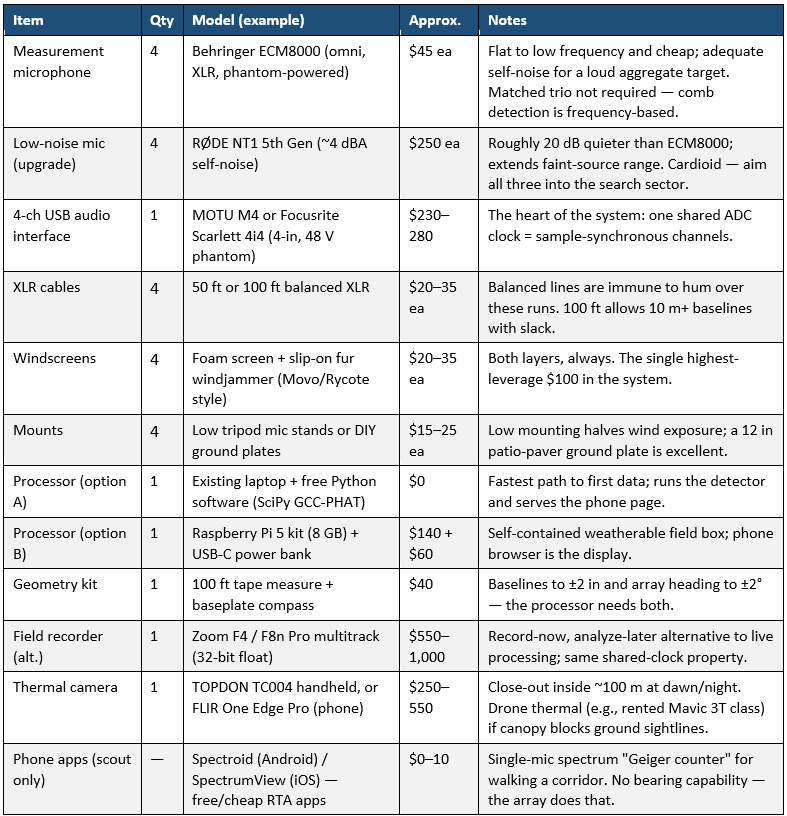
Prototype total (budget mics + laptop): roughly $700–900. With Pi field box and thermal handheld: roughly $1,200–1,600. No commercial off-the-shelf product currently does multi-microphone hornet triangulation; commercial "acoustic cameras" (Sorama, Fluke ii-series) beamform beautifully but are optimized for ultrasonic leak survey at short range and cost $15k+ — wrong band, wrong price.
The single most valuable and least expensive step in this whole program is a recording day with ground truth, because no published dataset covers the Georgia population or nest-proximity flight. Four recordings close the gap: (1) captured hornets — GDA traps hornets by the hundreds in season; caged individuals recorded at 2–3 ambient temperatures pin the local fundamental band and its temperature slope; (2) a known nest — GDA eradicates dozens of nests per year; one hour of array recording at 100–200 m before a scheduled destruction is the direct answer to "what does a nest sound like at range," and validates or corrects the +20–30 dB aggregate estimate; (3) a confuser library — an hour each of carpenter bees, bumble bees, honeybee hives, and local mechanical noise, so the classifier's false-alarm rate is measured, not assumed. And (4): an hour of sentinel audio at a hive under active hawking — hissing/piping rates and flight-tone dropout — pins the local A. mellifera distress signature the Section 2.5 trigger keys on. With those in hand, the comb template and detection thresholds stop being estimates.
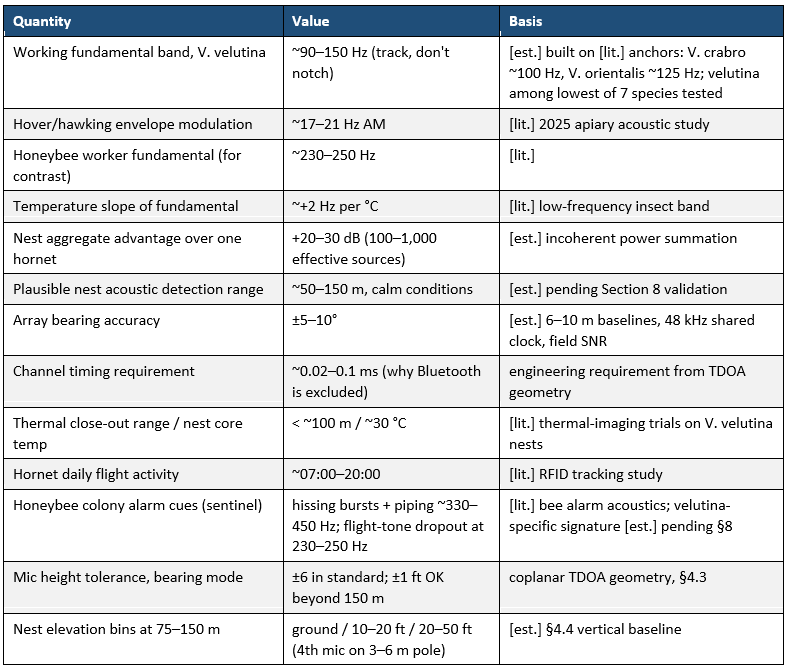
Honest unknowns, in order of importance. First, the nest aggregate level has never been measured — the +20–30 dB figure is arithmetic, not data, and the paper nest envelope (layered, air-gapped, built for thermal insulation) will damp interior sound, leaving exterior flight traffic as most of the signal; Section 8's known-nest recording resolves this directly. Second, Georgia-population wingbeat values are unmeasured; the band is anchored on European and lab data. Third, loaded-flight frequency shift is asserted in direction-unknown form. Fourth, dense understory between array and nest adds scattering loss beyond the free-field estimate, and a nest near a highway or compressor may be masked in exactly the band that matters. Fifth, carpenter bees are a genuinely overlapping confuser in Florida and Georgia and must be in the validation library before any detection is trusted. None of these threaten the architecture; all of them are one recording day from being numbers instead of adjectives.
Herrera et al., Pest Management Science 79:1225–1233 (2023) — first reported V. velutina wingbeat fundamental; optical sensor + ML species classification. • ScienceDirect (Computers & Electronics in Agriculture, 2025) — remote acoustic detection of V. velutina hovering at apiaries; 17–21 Hz spectral repetition feature. • Couto et al., PLOS ONE (2014) — olfactory attraction to hive odors and geraniol. • Poidatz et al. (2018) — RFID activity rhythm and ~5,000 m homing range. • Lioy et al., Insect Science (2021) — thermal imaging viability for nest detection. • Kennedy et al. (2018) — radio-telemetry nest searches; thermal useful <100 m. • Georgia Dept. of Agriculture yellow-legged hornet program — trapping/eradication statistics and reporting channel. • Mattila et al., Royal Society Open Science (2021) — frenetic antipredator piping in Apis cerana colonies under hornet attack. • Requier et al., Journal of Pest Science (2019) — foraging paralysis of A. mellifera under V. velutina hawking pressure.